The end of the year brings a flood of lists purporting to sum up the the year we’re leaving or to make bold predictions about the year to come. Far too many of them predict exponential growth of something. I understand that, to most people, “exponential growth” is really just an expression which loosely translates to “really freaking fast”, but come on. It’s math.
Being cavalier with math never pays off in the long run.
So, I have produced a handy guide to growth rate taxonomy.
Linear Growth

Linear growth occurs at a constant interval. If it went up by one over the last period, it will go up by one over the next period. If it went up by 1,000,000 last time, it’ll go up by 1,000,000 next time. The size of the steps is constant.
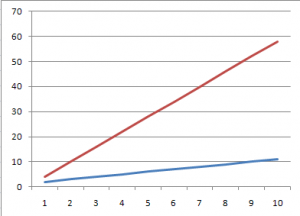
Here, the blue line grows at a rate of +1, the red line at a rate of +5. Both are linear. They will each always increase by +1 and +5 per step.
Geometric Growth
 In geometric growth, size of the steps increases by a constant multiple. So in linear growth, the same number was added with each step. In geometric growth, the same number is multiplied with each step.
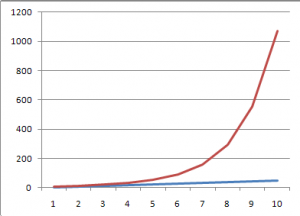
Here, the blue line is our linear +5. The red line is *2 (doubling with every step).
Exponential Growth
 In exponential growth, the steps increase by a constant exponent. So the rate of growth increases with each step. In geometric growth, we multiplied by 2. In exponential growth, we raise to a power of 2 (or whatever), so we multiply by an ever increasing amount.
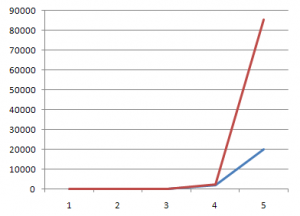
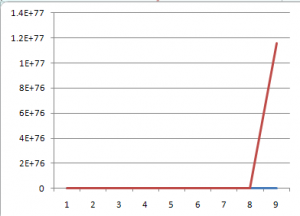
Here, the blue line is geometric growth of *10, the red line is exponential growth of *2. You might notice that the scale on this one only goes out five steps, instead of the ten the other graphs covered. That’s because exponential growth increases so quickly in the “out years” that everything else looked flat.
Like this.
Say what you want. I’m all for colorful language. I’ll grind my teeth and smile when I hear it.
But you’re not talking about exponential growth.
{ Comments on this entry are closed }


